Bayesian Approaches to Mixed (aka Hierarchical, aka Multilevel) Models


Mixed Models

  • We have used these to tease out variation in parameters due to “blocks”

  • Many kinds of “blocks”

  • Variation can affect slopes and intercepts

  • Variation can come from continuous “blocks” - Gaussian Process Models

  • But what do we gain?

Gains from a Mixed Model Approach

  1. Shrinkage of Estimators

  2. Accurate post-hoc comparisons

  3. Better ability to make focused predictions

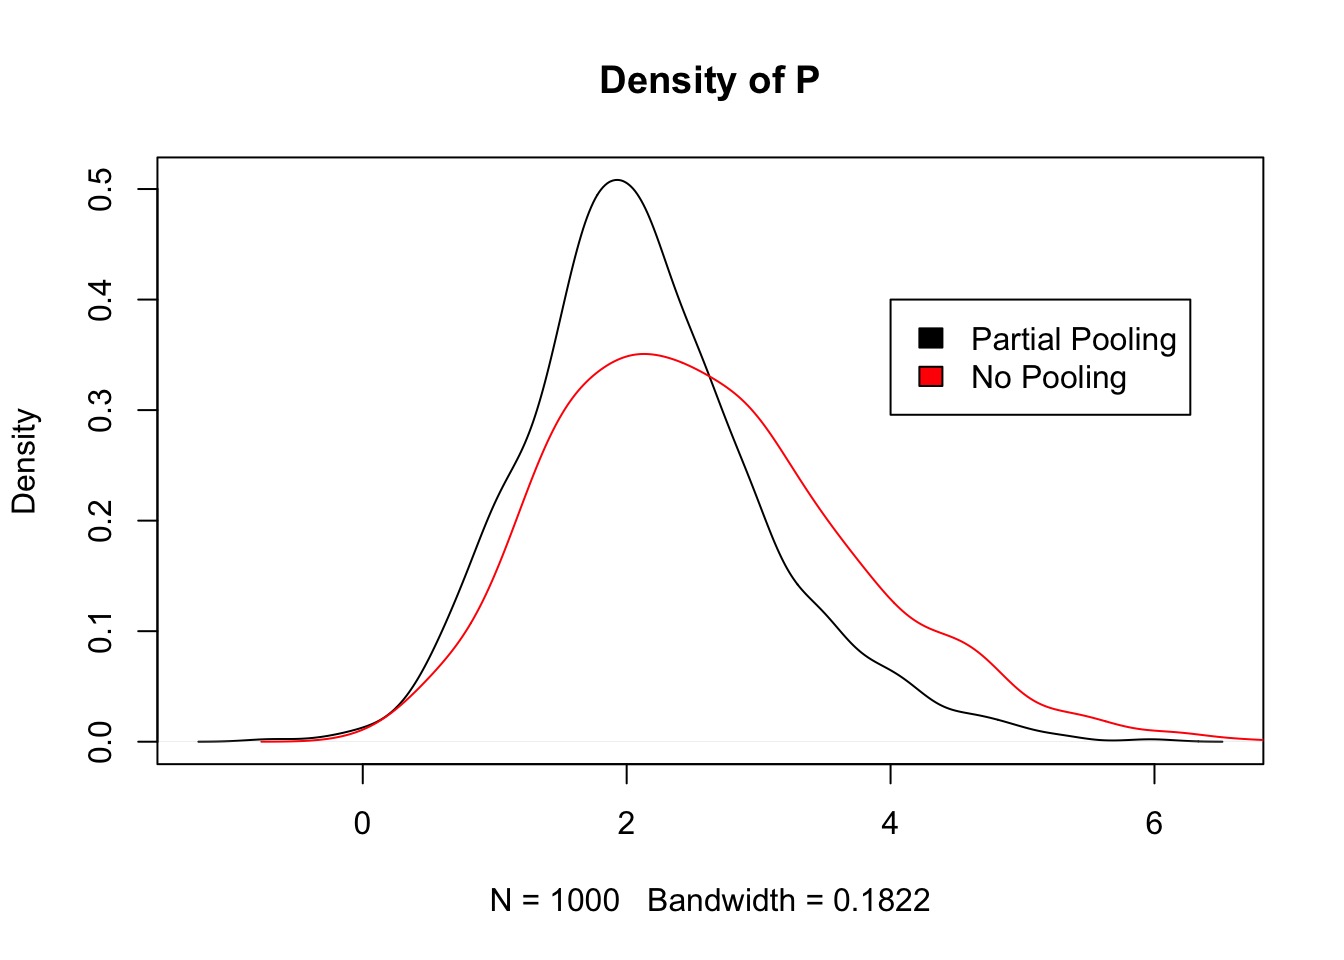
The Incredible Shrinking Frogs

The Reed Frog Data

  density pred  size surv propsurv
1      10   no   big    9      0.9
2      10   no   big   10      1.0
3      10   no   big    7      0.7
4      10   no   big   10      1.0
5      10   no small    9      0.9
6      10   no small    9      0.9

Tank as a block

  • 48 tanks

  • Each tank has different number of frogs

  • Each frog is a “replicate”
    • 1/0 live/die

  • Each tank is a “block”

Three ways of looking at survivorship


1. Every tank has the same survivorship (complete pooling)

2. Every tank has its own unique survivorship (no pooling)

3. Every tank is similar to others, but with some variation in survivorship (partial pooling)

Complete Pooling


Estimates mean probability across all tanks

No Pooling

Each tank is independent

Partial Pooling and Hyperparameters

p[tank] ~ dnorm(0,10)

P[tank] can be anything, and our prior for p[tank] shows a distribution of possible values


But now…
p[tank] ~ dnorm(p_hat, sigma_tank)

P[tank] is drawn from a distribution, and p_hat and sigma_tank are hyperparameters, each with their own prior

This can go on forever…


Partial Pooling


\[p_j \sim dnorm(\widehat{p} , \sigma_{tank})\]

The Mathy Version

Likelihood
\(Survivors_j \sim dbinom(density_j , prob_j)\)

Data Generating Process
\(logit(prob_j) = p_j\)

\(p_j \sim dnorm(\widehat{p} , \sigma_{tank})\)

Priors
\(\widehat{p} \sim dnorm(0,10)\)
\(\sigma_{tank} \sim dcauchy(0,2)\)

Why Partial Pooling?

  1. Share information across blocks
    • estimate of one block informs the other
    • super helpful with unbalanced designs
    • Enables Best Least Unbiased Predictor (BLUP) of observations

  2. Reduces number of effective parameters

  3. Improved estimation of true underlying parameter
    • Observed values have additional error, reduces accuracy

Sharing Information for Estimation

  • We already do this with regression

  • Regression model fits a line and generates predictions

  • Values in one data point inform estimates of another data point

  • Predictions are akin to BLUPs

  • Estimation of points shrinks to a regression line

Shrinkage in Frog Survivorship

Shrinkage and Unbalanced Designs


Partial Pooling Better for Unbalanced Designs

Comparing Approaches

               WAIC pWAIC dWAIC weight    SE   dSE
fit          1011.1  38.5   0.0      1 38.15    NA
fit_nopool   1027.7  52.4  16.6      0 44.40  8.58
fit_fullpool 1372.0   1.0 360.9      0 25.87 35.12
  • Improved fit from partial pooling

  • Big reduction in number of parameters
    • From reducing paramter variance (remember pWAIC definition!)

Reduced Parameter Variance

Fit and Overdispersion

  • Overdispersed models are kinda mixed models already
    • Parameters of distribution vary with their own distribution
    • We use a formal compound distribution, but the concept is the same

  • Mixed models have coefficients vary by distribution
    • Variation injected earlier, but similar effect

Oceanic Tool Use

     culture population contact total_tools mean_TU
1   Malekula       1100     low          13     3.2
2    Tikopia       1500     low          22     4.7
3 Santa Cruz       3600     low          24     4.0
4        Yap       4791    high          43     5.0
5   Lau Fiji       7400    high          33     5.0
6  Trobriand       8000    high          19     4.0

A Typical Model

Overdispersion?


Mild, but yes.

An Overdispersed Model

Overdispersion needed

      Mean StdDev lower 0.89 upper 0.89 n_eff Rhat
a     0.98   1.57      -1.58       3.22   291 1.00
bp    0.28   0.17       0.01       0.54   297 1.00
scale 2.22   0.94       0.86       3.57   356 1.01

Overdispersion helps

What about modeling random variation in societies?

Overdispersion Handled Here, Too

Exercise

  • Revisit the Reed Frog survivorship

  • Fit models with 1) predation and frog size acting additively, 2) both interacting, and 3) a null model.
    • All should have tank as a random effect.

  • Feel free to try with lme4 first just to get your bearings

  • Compare all three with WAIC

  • How does sigma_tank change across the different models?