Jarrett Byrnes
UMass Boston
https://biol609.github.io/
Outline for Today
Who are you?
How will this course work?
What are we doing here?
Rethinking everything
Who are You?
Name
Lab
Brief research description
Why are you here?
Outline for Today
Who are you?
How will this course work?
What are we doing here?
Rethinking everything
Second, Some Old Technology
![]()
- Green: Party on, Wayne
- Red: I fell off the understanding wagon
- Yellow: Slow down, Mister Teacher
- Blue: Write a question/Other
Interact via Slack
![]()
- Join the #Biol609 channel
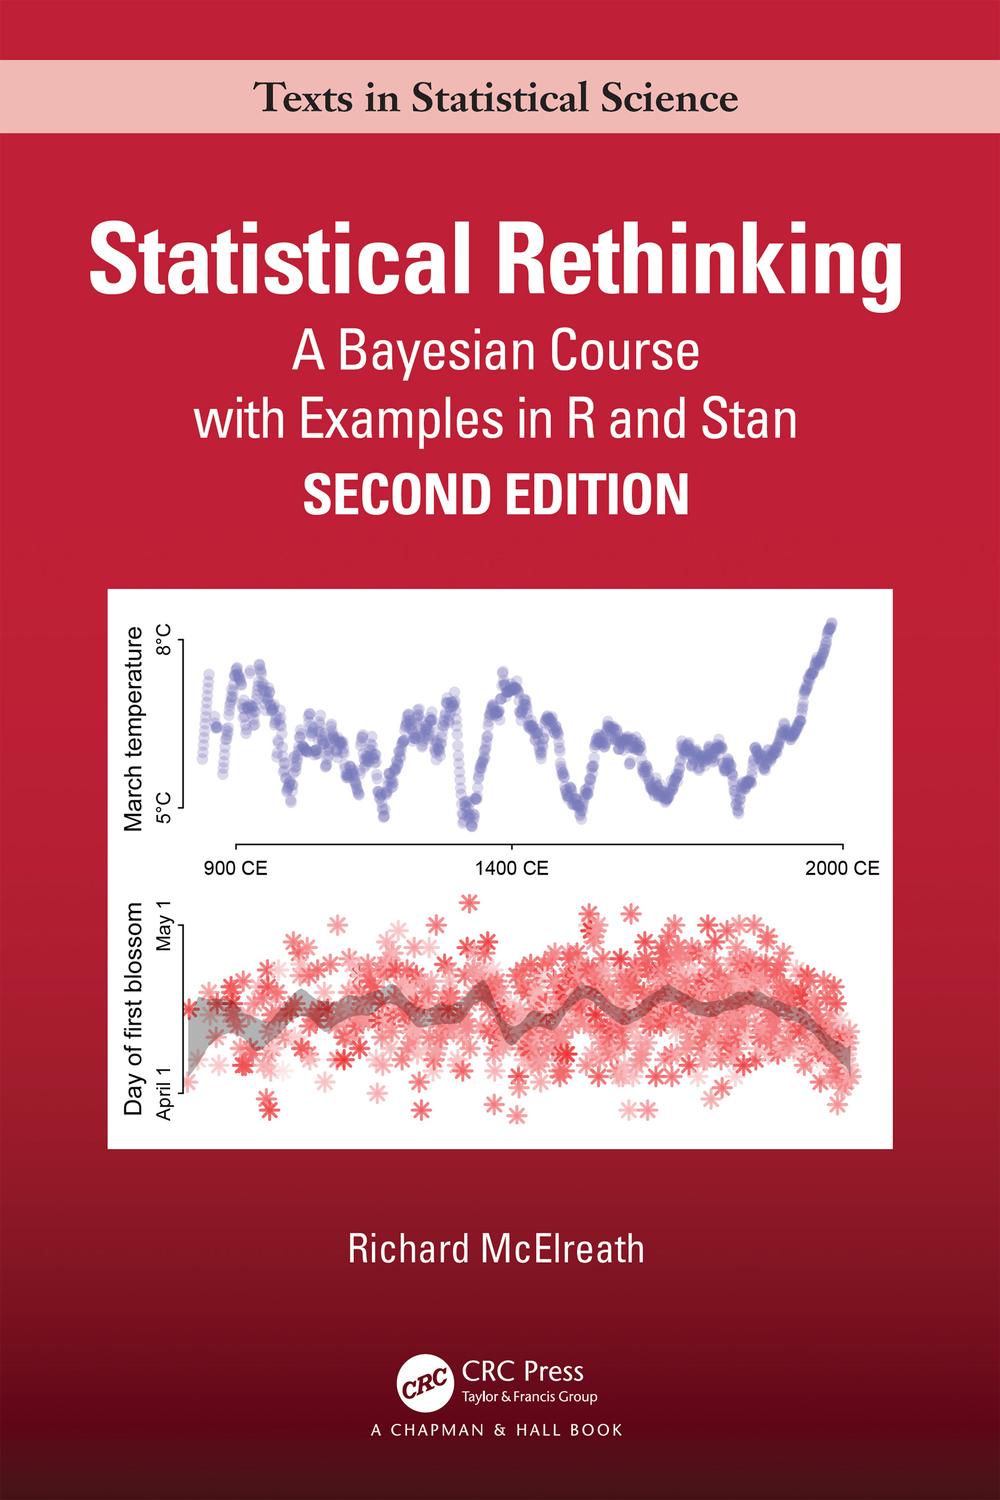
The Book: Statistical Rethinking 2nd Edition
![]() ## Some
Scaffolding Reading
## Some
Scaffolding Reading ![]()
Before Every Class
The Questions I Will Ask About Readings at Random -
What did you not get? (Don’t be shy!) (This might be all we talk
about).
Final Paper
Do your research
(but be Bayesian about it)
Outline for Today
Who are you?
How will this course work?
What are we doing here?
Rethinking everything
Model-A-Palooza
Objective 1) To learn how to think about your study
system and research question of interest in a systematic way and match
it with a realistic process-based model.
Enter The Reverend
Objective 2) To understand how to build and fit
complex models in a Bayesian framework.
The Rest of Your Life
Objective 3) Provide the grounding needed to
effectively collaborate with statistical experts.
Objective 4) Allow students to gain the knowledge
necessary to become life-long learners of data analysis techniques, able
to incorporate new techniques into their analytic toolbelt as
needed.
My True Goal in this Class
Outline for Today
Who are you?
How will this course work?
What are we doing here?
Rethinking everything
Outline for Today
Who are you?
How will this course work?
What are we doing here?
Rethinking everything
How do You View Data Analysis?
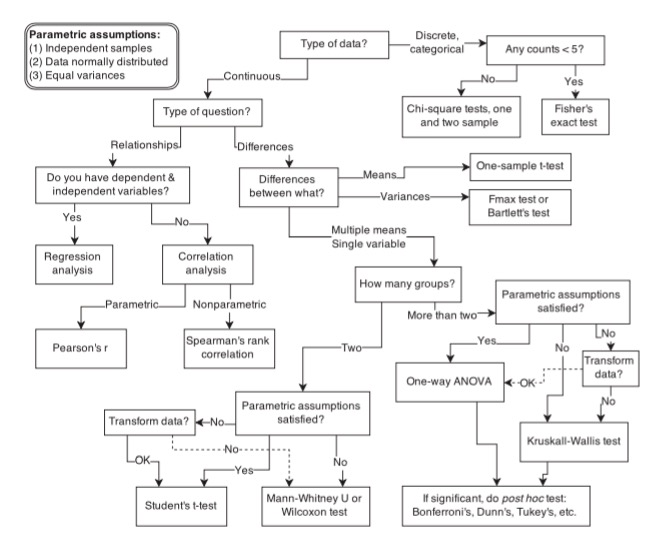
A Common Way to Think about Data Analysis
![]()
NO!
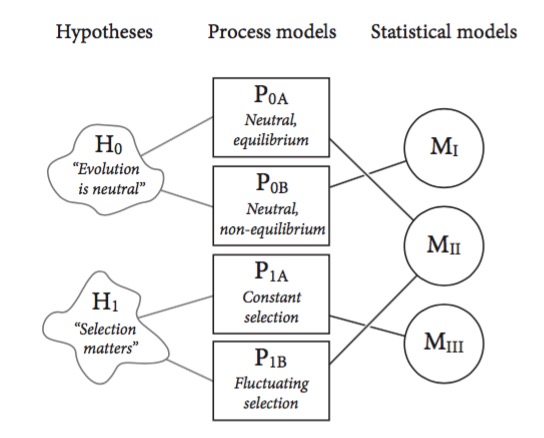
One Hypothesis ≠ One Statistical Model
![]()
Apply this to your research!
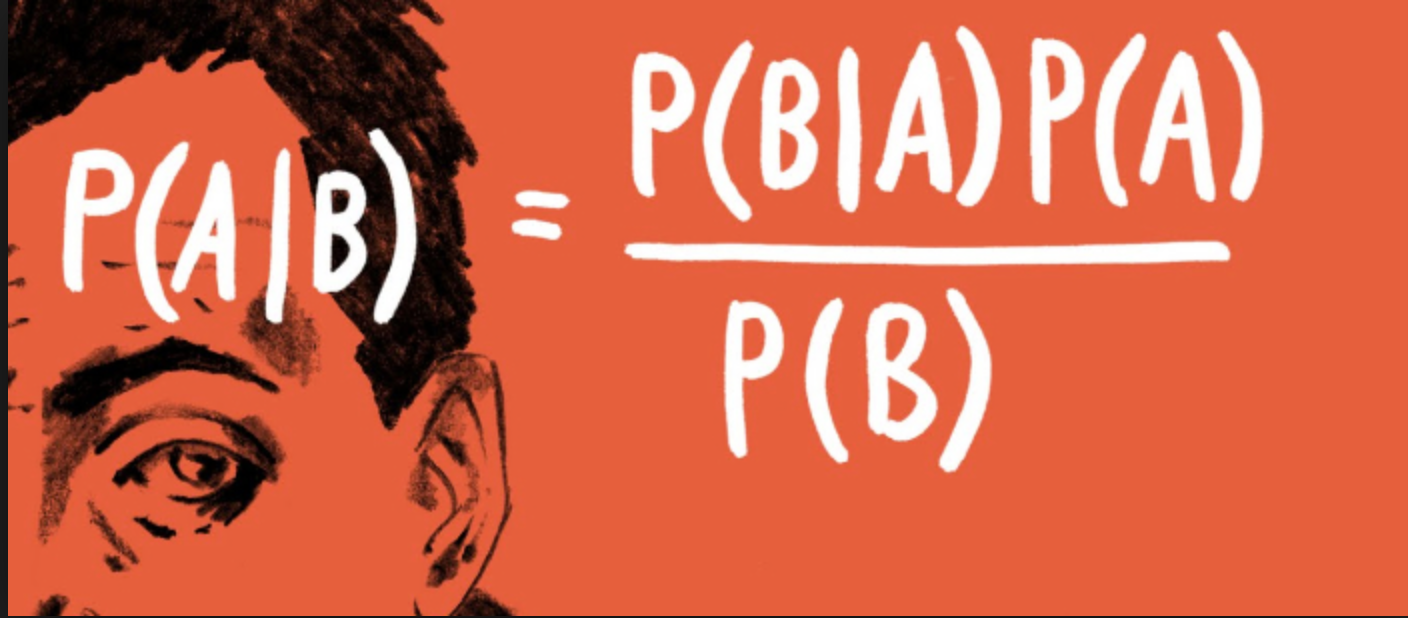
Back to Bayes-ics
![image]()
Bayesian Inference
![image]()
Estimate probability of a parameter
State degree of believe in specific parameter values
Evaluate probability of hypothesis given the data
Incorporate prior knowledge
- Frequentist: p(x ≤ D | H)
- Likelihood-ist: p( D | H)
- Bayesian: p(H | D)
What is the difference between these?
Let’s see how Bayes works
I have a bag with 6 stones. Some are black. Some are white.
I’m going to draw stones, one at a time, with replacement, and let’s see
the number of ways that the draw could have been produced.
After 4 draws, let’s calculate the probability of W white stones and B
black stones. Let’s formalize how we made this calculation. This leads
to conditional versus marginal probabilities.
Let’s see how Bayes works…
Now, I will look at the stones, and introduce a prior or some sort
for W.
Let’s do a new set of draws, but this time, on the board, update our
posterior.
And finally, relate this to the definition of Bayes theorem in 2.3.4 pg
36.
Let’s do this in R with Grid Sampling!
Use dplyr and mutate for the following.
- Chose what fraction of stones is white in a bag of infinite
size.
- Creat a column of possible values from 0 to 1.
- Define a prior as the second column.
- Calculate your posterior after 1 random draw, then repeat for draws
2-4 plotting your posteriors
- posterior = likelihood*prior/sum(all posterior values)
- Plot your posterior given 100 draws, given your initial prior.
Introducing rethinking
This is from the Rcode on page 42, box 2.6. Assume 100 draws.
library(rethinking)

#alist is a list for used to define a model
draws_mod <- alist(

  #our likelihood
  w ~ dbinom(100, p)

  #our prior - can be something else if you want!
  p ~ dunif(0,1)
)

#define the data - you fill in the probability
draws_data <- list(w = XXX)

#We will use map - maximum a posteriori sampling
#Note, I use rethinking:: in case you've loaded purrr
draws_fit <- rethinking::map(draws_mod,
                             data = draws_data)
Now let’s explore our output
draws_fit

summary(draws_fit)


 ## Some
Scaffolding Reading
## Some
Scaffolding Reading